

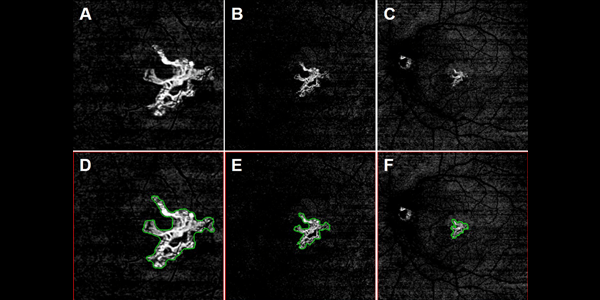
Image: En face flow images from the left eye of a 74 year-old woman with CNV. The CNV was identified from a slab with segmentation boundaries that extended from the ORCC. (A) 3 × 3 mm ORCC image. (B) 6 × 6 mm ORCC image. (C) 12 × 12 mm ORCC image. (D) 3 × 3 mm ORCC image with the CNV outlined (area = 0.86 mm2). (E) 6 × 6 mm ORCC image with the CNV outlined (area = 0.89 mm2). (F) 12 × 12 mm ORCC image with the CNV outlined (area = 1.19 mm2).
Fang Zheng; Qinqin Zhang; Elie H. Motulsky; João Rafael de Oliveira Dias; Chieh-Li Chen; Zhongdi Chu; Andrew R. Miller; William Feuer; Giovanni Gregori; Sophie Kubach; Mary K. Durbin; Ruikang K. Wang; Philip J. Rosenfeld
Investigative Ophthalmology & Visual Science. October 2017, Vol.58, 5098-5104.
Abstract
Purpose
We compared area measurements for the same neovascular lesions imaged using swept source optical coherence tomography angiography (SS-OCTA) and enlarging scan patterns.
Methods
Patients with neovascular age-related macular degeneration were imaged using a 100-kHz SS-OCTA instrument (PLEX Elite 9000). The scanning protocols included the 3 × 3, 6 × 6, 9 × 9, and 12 × 12 mm fields of view. Two groups were studied. Group 1 included small lesions contained within the 3 × 3 mm scan, and Group 2 included larger lesions that were fully contained within the 6 × 6 mm scan.
Results
A total of 30 eyes of 26 patients were enrolled in Group 1 and 30 eyes of 25 patients were enrolled in Group 2. In Group 1, the automated mean lesion area measurements were 1.11 (SD = 0.78), 1.14 (SD = 0.80), and 1.27 (SD = 0.82) mm2 for the 3 × 3, 6 × 6, and 12 × 12 mm scans, respectively (ANOVA P < 0.001; post hoc comparisons, P = 0.184, 3 × 3 vs. 6 × 6 mm; P < 0.001 for the other two pairs). In Group 2, the automated mean lesion area measurements were 5.43 (SD = 2.56), 5.53 (SD = 2.48), and 5.49 (SD = 2.65) mm2 for the 6 × 6, 9 × 9, and 12 × 12 mm scans, respectively (ANOVA P = 0.435; post-hoc comparisons, P = 0.062, 6 × 6 vs. 9 × 9 mm; P = 0.553, 6 × 6 vs. 12 × 12 mm; P = 0.654, 9 × 9 vs. 12 × 12 mm).
Conclusions
The similarity in lesion area measurements across different scan patterns suggests that SS-OCTA imaging can be used to follow quantitatively the enlargement of choroidal neovascularization as the disease progresses.